Dashboard
The dashboard is the main operational overview after sign-in. It can work as a default overview, a saved custom view, or a kiosk-style full-screen layout.
On this screen
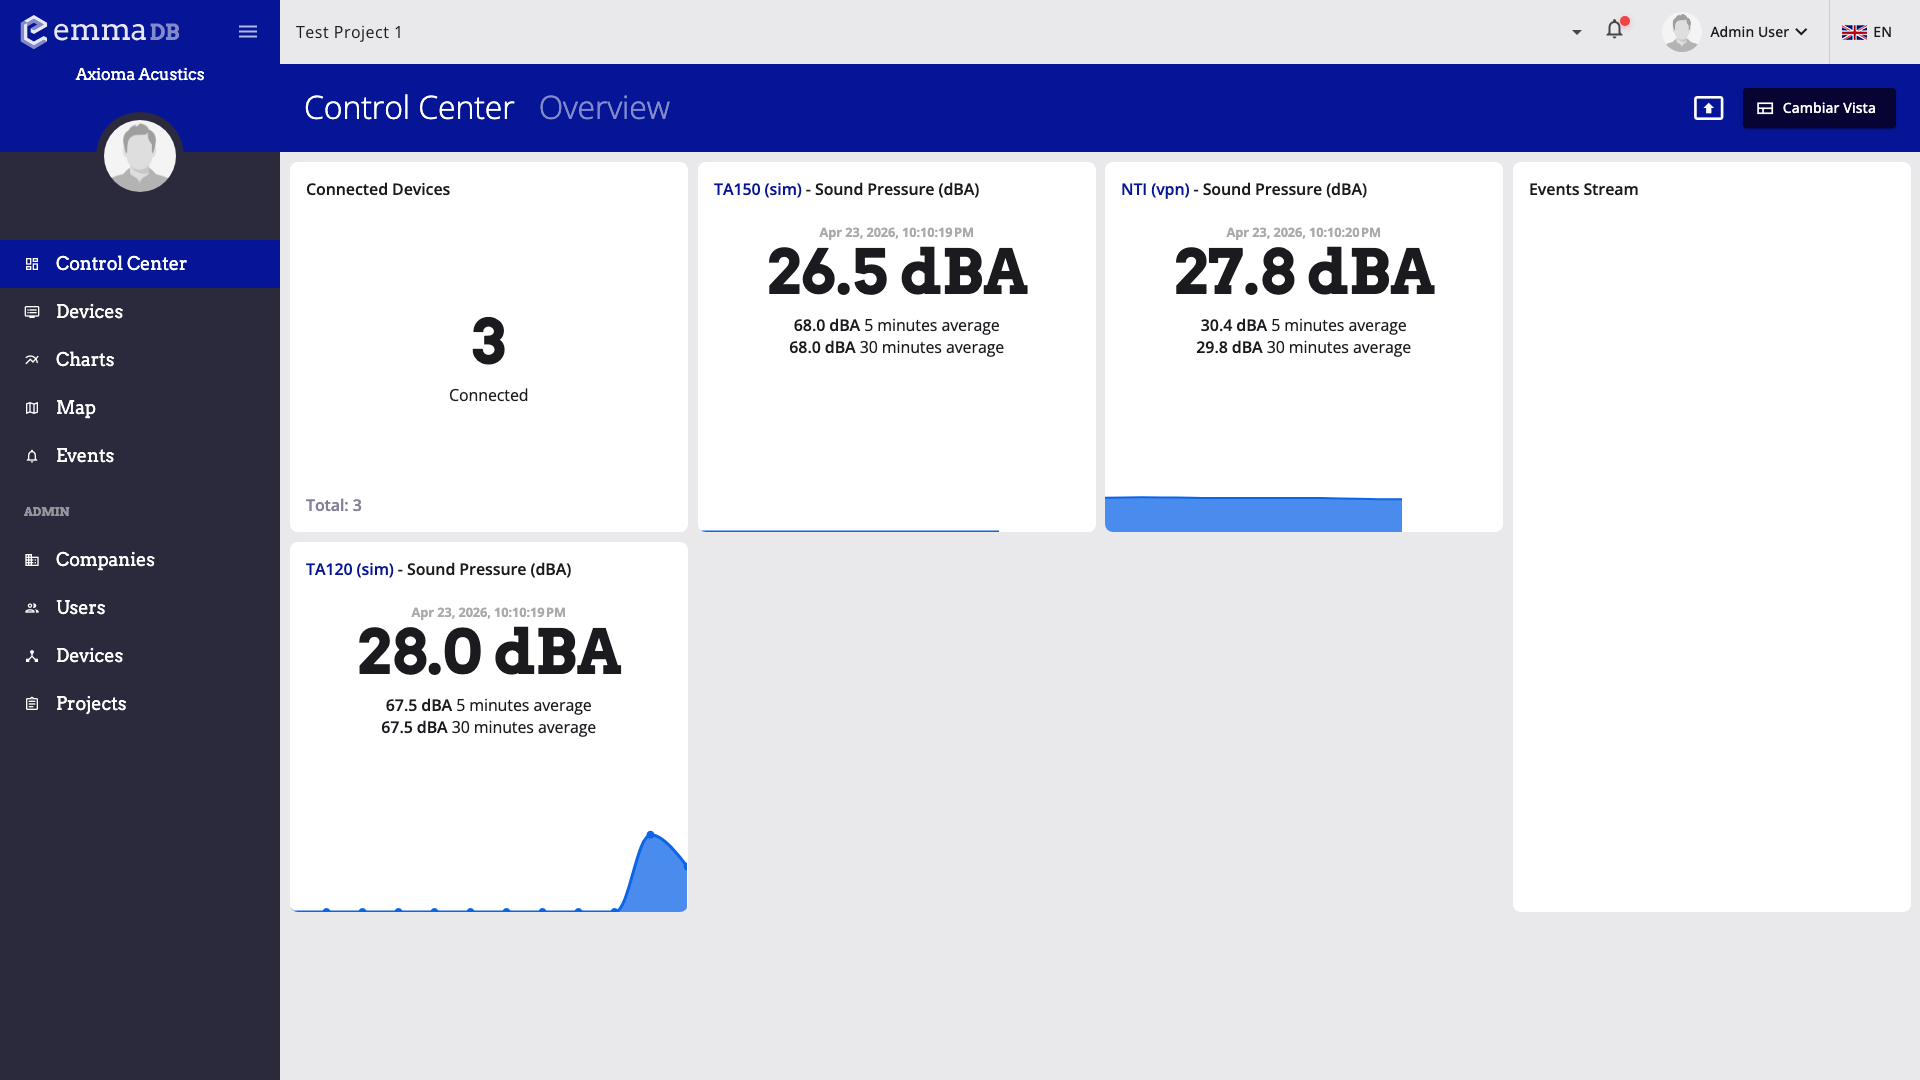
- Review connected devices and the main monitoring cards.
- Use the toolbar to switch views, edit the current view, or enter full-screen kiosk mode.
- Check the event stream to spot recent warnings, alarms, and device activity.
In this section
What you can do here
- Start from the default dashboard for a quick project-wide overview.
- Switch to saved views when different teams need different layouts.
- Build custom widgets when standard cards are too limited.
- Use kiosk mode for always-visible operations screens.