Data
On This Screen
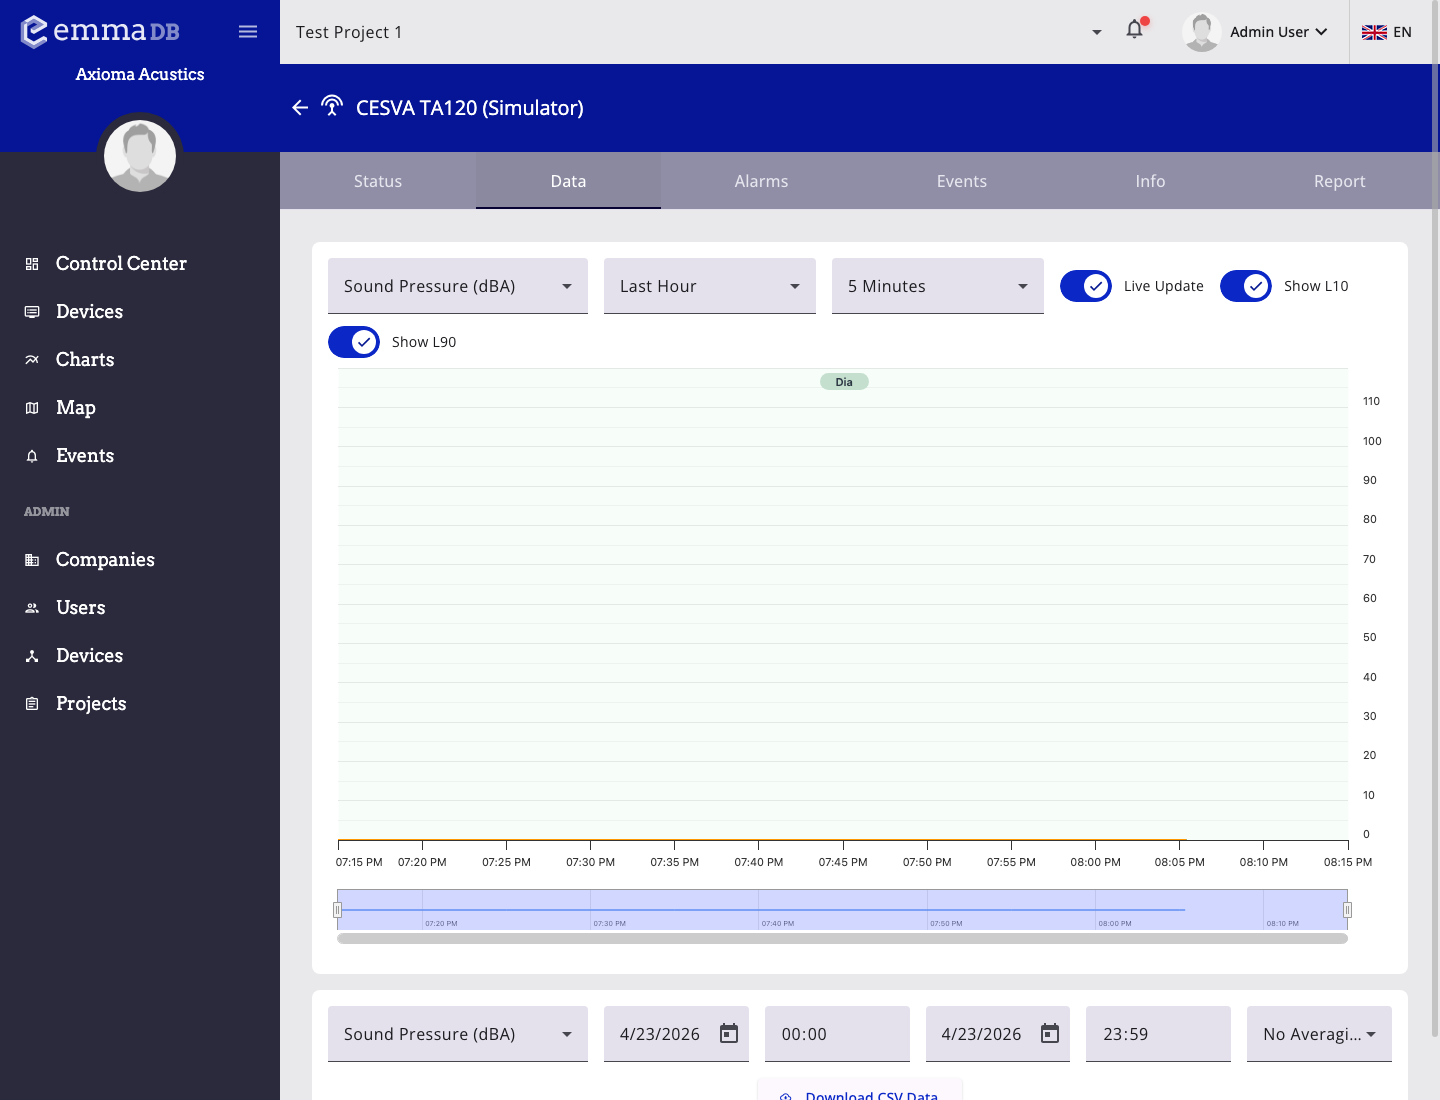
- Select a measured field, time range, aggregation, and live-update option.
- Review the chart and any related alarm thresholds or project period bands.
- Export CSV data from the lower section after setting the export field and range.
Use Data when you need historical analysis instead of only the latest reading.
Main Controls
- Choose the measurement field from the first selector.
- Choose a preset range or Custom.
- Set manual start and end date/time when using Custom.
- Choose aggregation when the selected field supports it.
- Enable Live update when it is available for the selected range.
Chart Behavior
- The main chart updates when you change the field, time range, or aggregation.
- Grouped acoustic fields can show L10 and L90 when those values are available.
- Compatible fields can also show a linked spectrum view.
- Device and project alarms can be drawn on the chart as threshold references.
- Project periods can appear on the chart as visual bands.
For analysis across several devices or a broader project context, use the main Charts page.
Export CSV
The lower card in the Data tab is used to export data to CSV.
- Choose the field to export.
- Choose the export date and time range.
- Choose whether to export instant data or 5-minute grouped data.
- Download the file when the selection is ready.